Detailed Austin Housing Market Update- 𝐀𝐮𝐬𝐭𝐢𝐧-𝐑𝐨𝐮𝐧𝐝 𝐑𝐨𝐜𝐤 𝐌𝐒𝐀 𝐡𝐨𝐮𝐬𝐢𝐧𝐠 𝐦𝐚𝐫𝐤𝐞𝐭 𝐜𝐨𝐧𝐭𝐢𝐧𝐮𝐞𝐬 𝐭𝐨 𝐧𝐨𝐫𝐦𝐚𝐥𝐢𝐳𝐞; REALTORS® report recent uptick in activity.
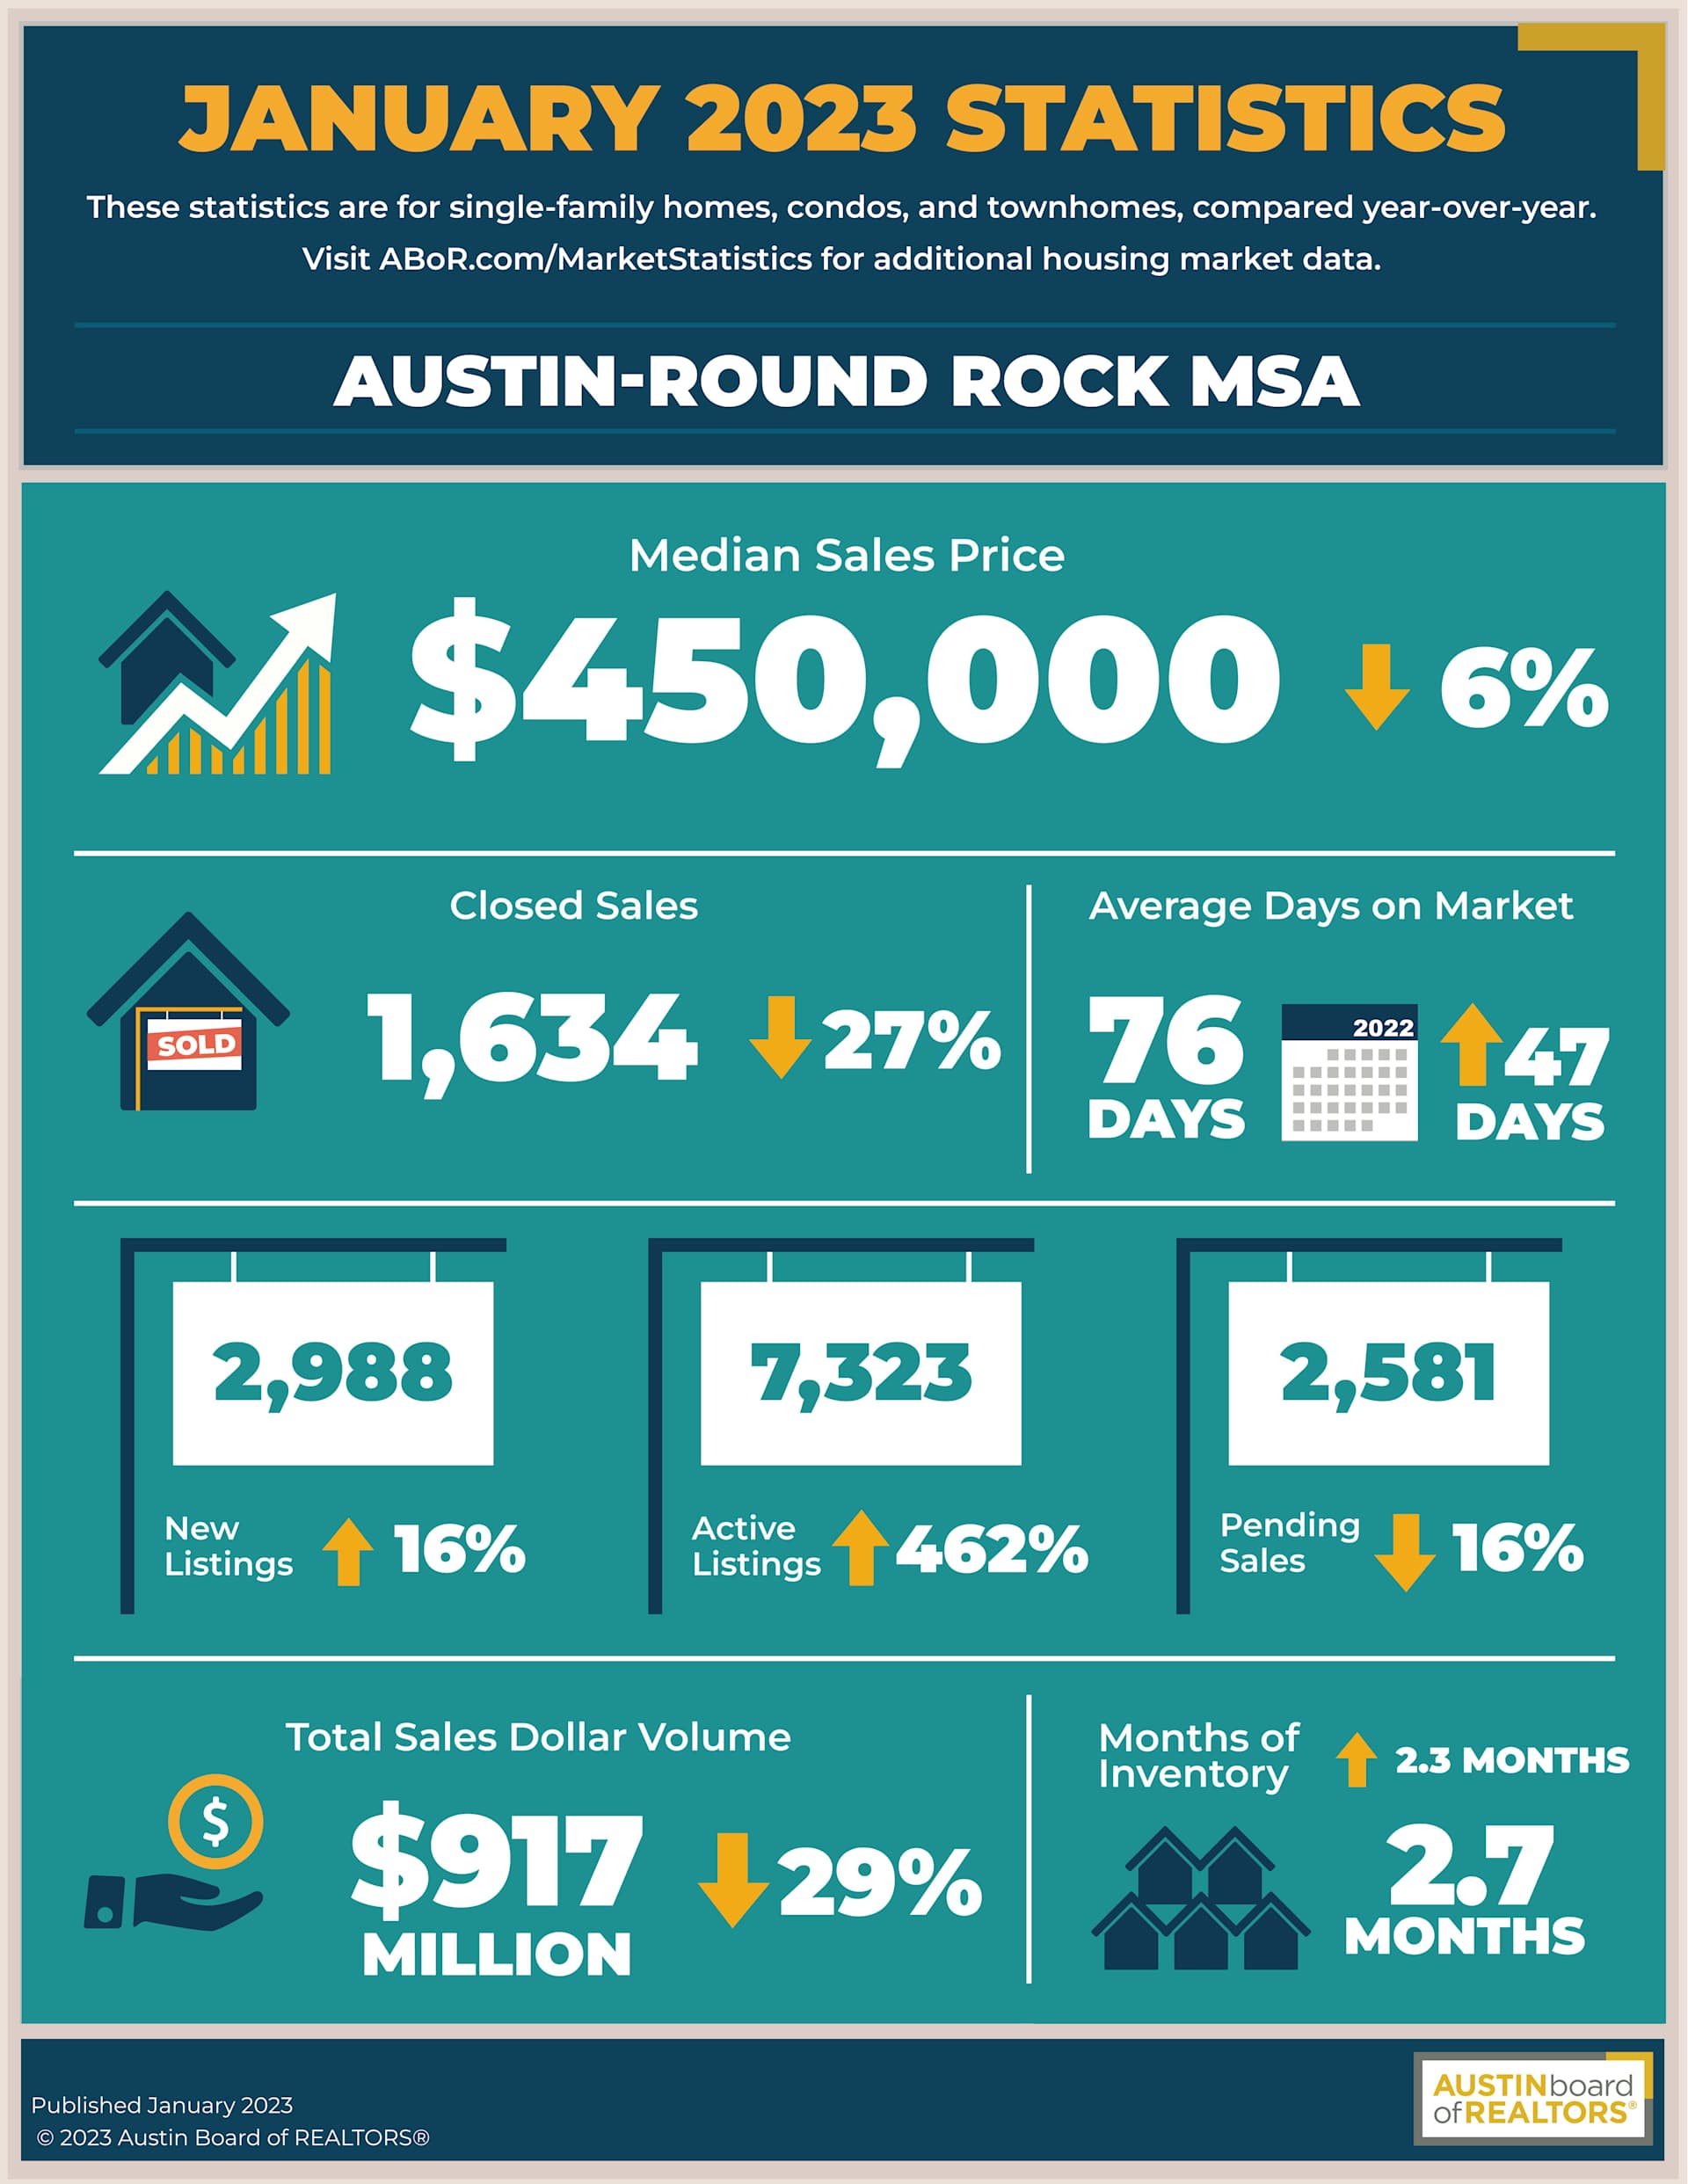
In January, 𝙢𝙚𝙙𝙞𝙖𝙣 𝙝𝙤𝙢𝙚 𝙥𝙧𝙞𝙘𝙚𝙨 𝙙𝙧𝙤𝙥𝙥𝙚𝙙 6.3% 𝙩𝙤 $450,000, the largest price drop since July 2011, according to the Austin Board of REALTORS® latest Central Texas Housing Report. Despite the price decrease, 𝙢𝙤𝙣𝙩𝙝𝙡𝙮 𝙝𝙤𝙪𝙨𝙞𝙣𝙜 𝙞𝙣𝙫𝙚𝙣𝙩𝙤𝙧𝙮 𝙨𝙩𝙖𝙮𝙚𝙙 𝙛𝙡𝙖𝙩 at 2.7 months of inventory from December 2022, demonstrating that this market is still in need of more housing as the industry standard is that six months of available inventory is considered a balanced market between buyers and sellers.
In January, residential home sales declined 27.3% year-over-year to 1,634 closed sales and sales dollar volume declined 29.1% to $917,954,115. 𝙉𝙚𝙬 𝙡𝙞𝙨𝙩𝙞𝙣𝙜𝙨 𝙙𝙧𝙤𝙥𝙥𝙚𝙙 16% year-over-year to 2,988 listings while pending listings dropped 16.7% to 2,581 transactions. Monthly housing inventory increased 2.3 months to 2.7 months of inventory, and 𝙝𝙤𝙢𝙚𝙨 𝙨𝙥𝙚𝙣𝙩 𝙖𝙣 𝙖𝙫𝙚𝙧𝙖𝙜𝙚 𝙤𝙛 76 𝙙𝙖𝙮𝙨 𝙤𝙣 𝙩𝙝𝙚 𝙢𝙖𝙧𝙠𝙚𝙩 homes spent an average of 76 days on the market, up 47 days from January 2022, but only up three days from December 2022.
When looking at the added context of month-to-month changes from December 2022 to January 2023, in addition to a modest change in days on market, new listings increased 63.4% to 2,988 month-to-month. This demonstrates that sellers see opportunity in this market. At the same time, buyers also were more active in January 2023 compared to December 2022 as pending listings increased 32.4% to 2,581.
While prices decreased in the City of Austin, Travis County and the MSA, 𝙨𝙪𝙧𝙧𝙤𝙪𝙣𝙙𝙞𝙣𝙜 𝘾𝙚𝙣𝙩𝙧𝙖𝙡 𝙏𝙚𝙭𝙖𝙨 𝙖𝙧𝙚𝙖𝙨 𝙖𝙧𝙚 𝙚𝙭𝙥𝙚𝙧𝙞𝙚𝙣𝙘𝙞𝙣𝙜 𝙖𝙣 𝙪𝙥𝙩𝙞𝙘𝙠 𝙞𝙣 𝙢𝙚𝙙𝙞𝙖𝙣 𝙝𝙤𝙢𝙚 𝙥𝙧𝙞𝙘𝙚𝙨.
Outlying areas like Caldwell and Hays counties are the most affordable pockets in Central Texas. When we have a city like 𝘼𝙪𝙨𝙩𝙞𝙣 𝙘𝙝𝙖𝙡𝙡𝙚𝙣𝙜𝙚𝙙 𝙗𝙮 𝙖𝙛𝙛𝙤𝙧𝙙𝙖𝙗𝙞𝙡𝙞𝙩𝙮, the entry point in surrounding areas will slightly increase as people try and find neighborhoods they can afford. These outer county data sets are reflective of affordability disappearing from Austin and closer-in suburbs hence why buyers are moving further out in Central Texas.
Housing affordability woes combined with higher interest rates play an outsized role in market activity. There is no national real estate market. Consumers need to follow local REALTORS® and local news while taking sensational headlines and reports with many grains of salt. Now more than ever, it is important for buyers and sellers alike to work with a REALTOR® who best understands how to navigate the changing landscape of our real estate market.
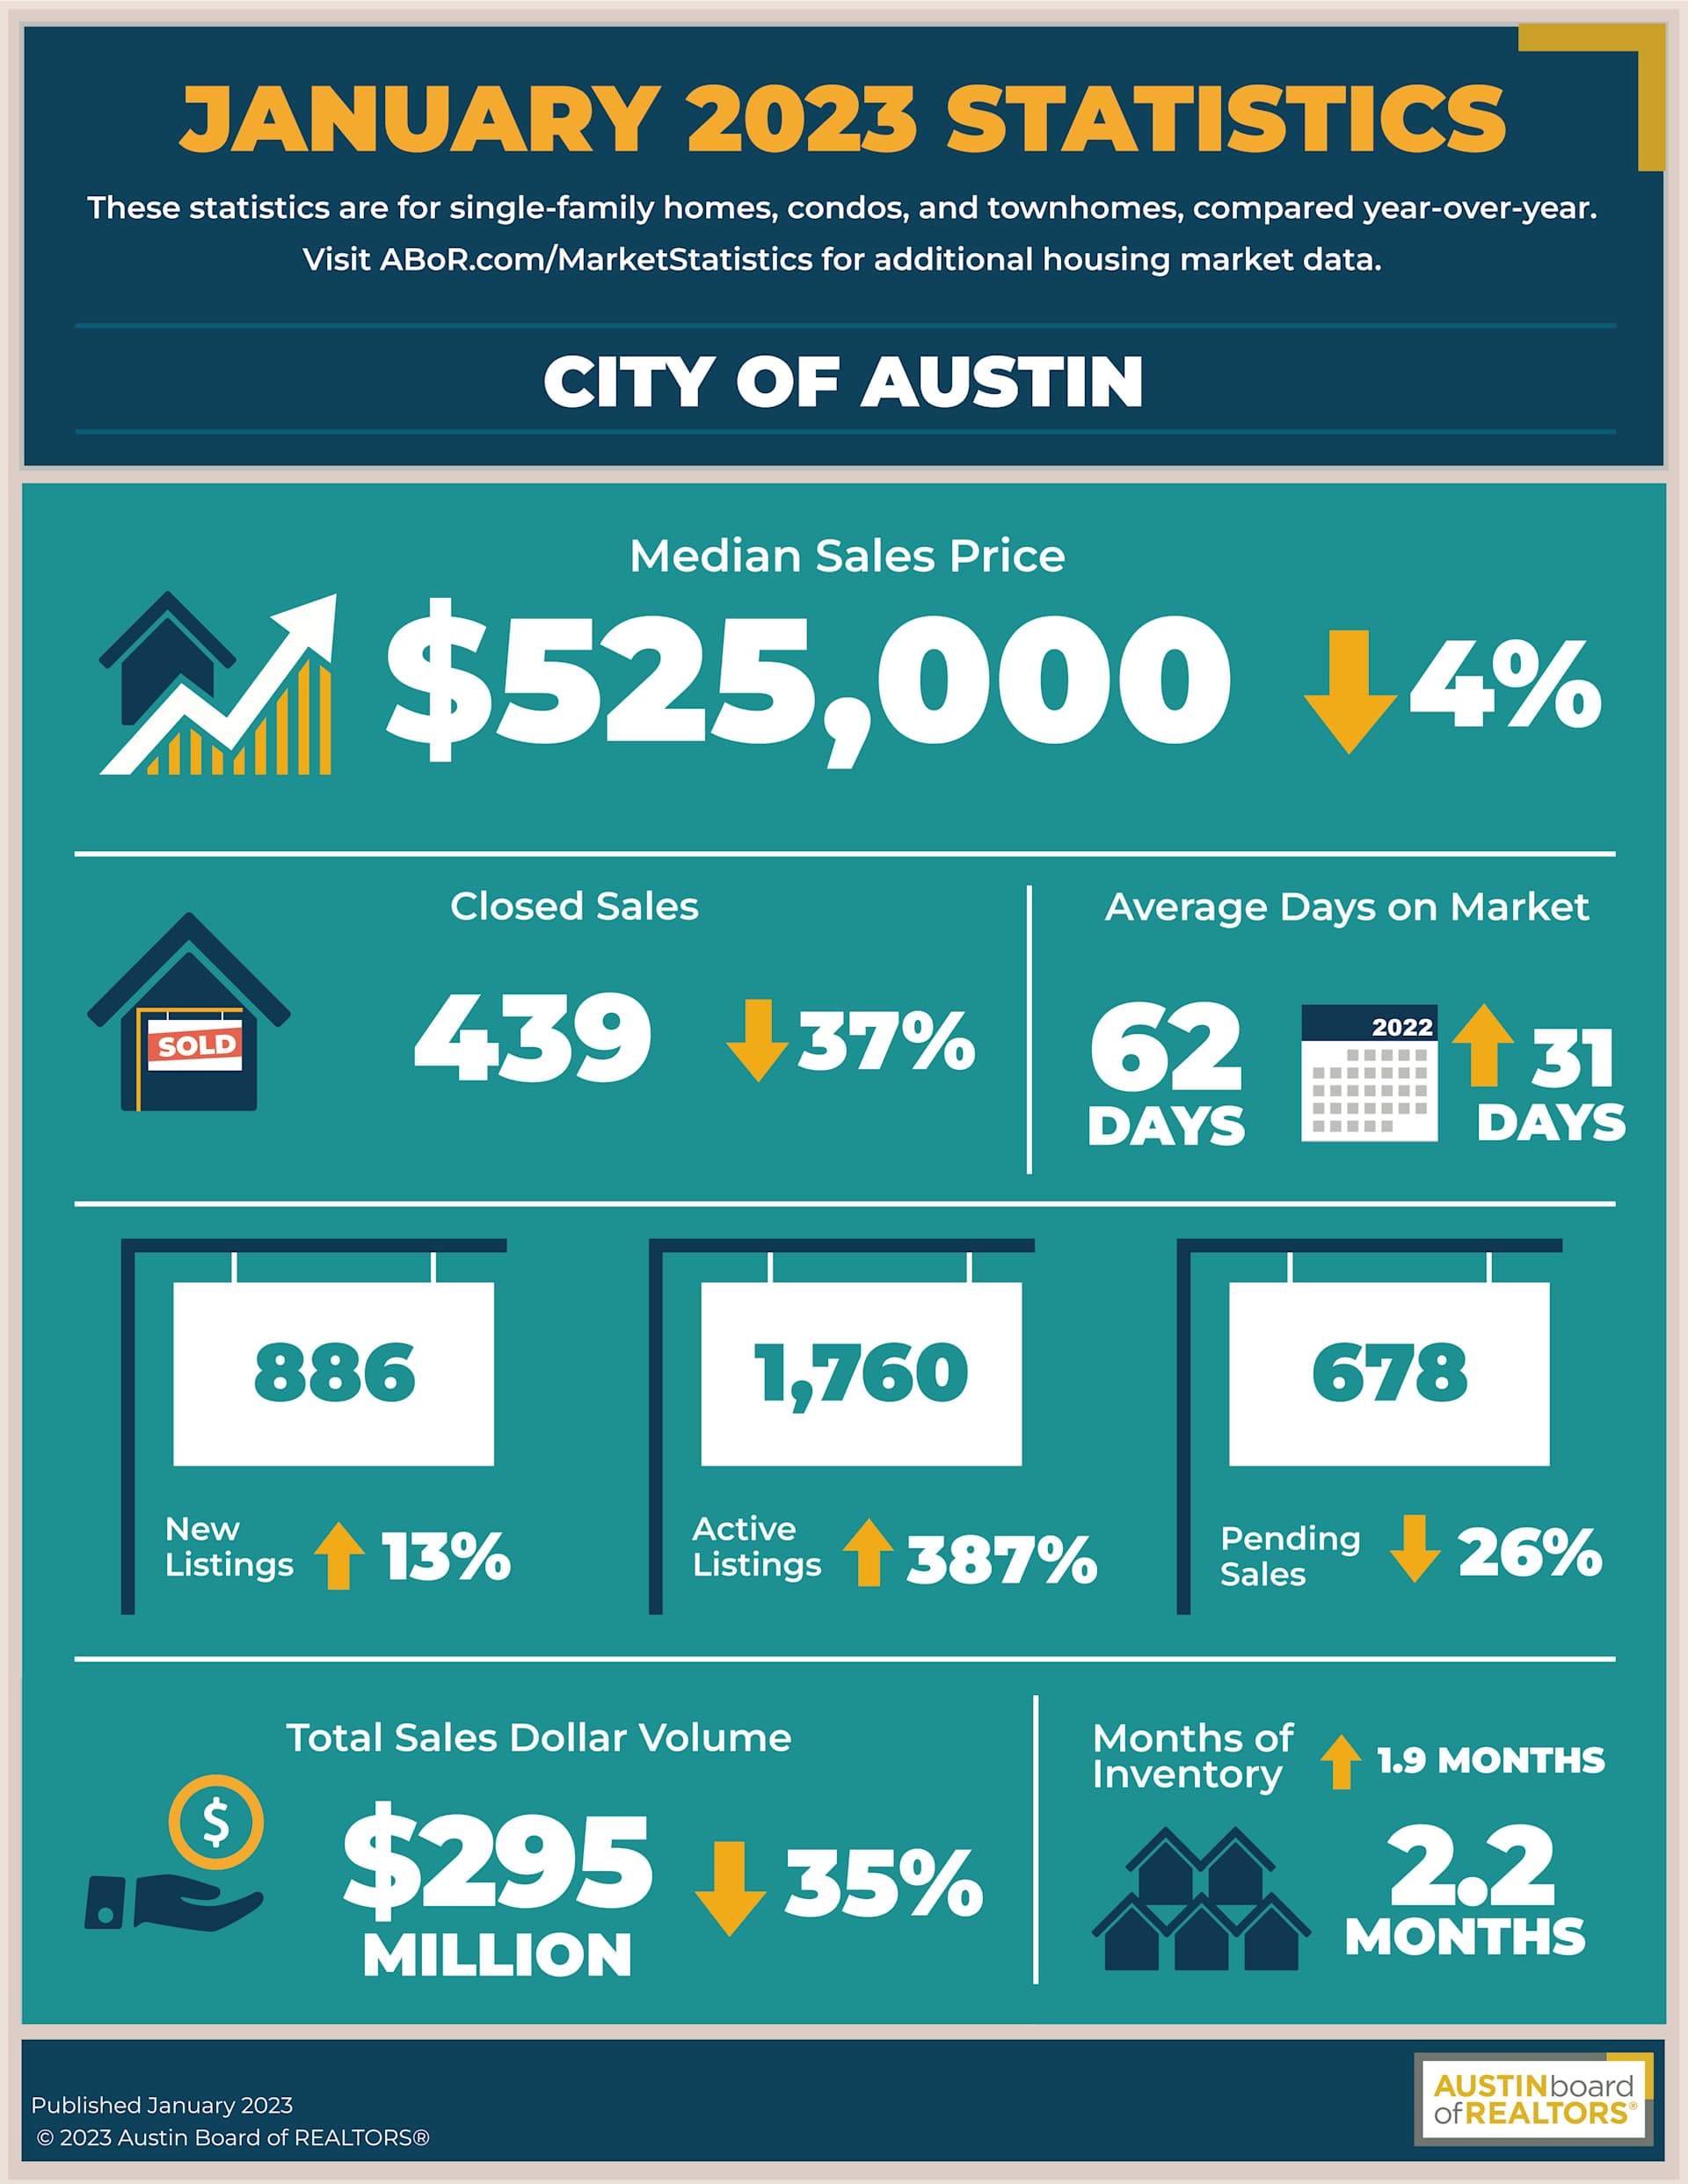
𝐂𝐢𝐭𝐲 𝐨𝐟 𝐀𝐮𝐬𝐭𝐢𝐧
In January, home sales decreased 37.3% to 439 sales, while sales dollar volume decreased 35.0% to $295,909,860. At the same time, median price slightly decreased 4.6% to $525,000 for the City of Austin. Last month, new listings ticked up 13.0% to 886 listings, active listings skyrocketed 387.5% to 1,760 listings as pending sales declined by 26.0% to 678 pending sales. Monthly housing inventory increased 1.9 months year over year to 2.2 months of inventory.
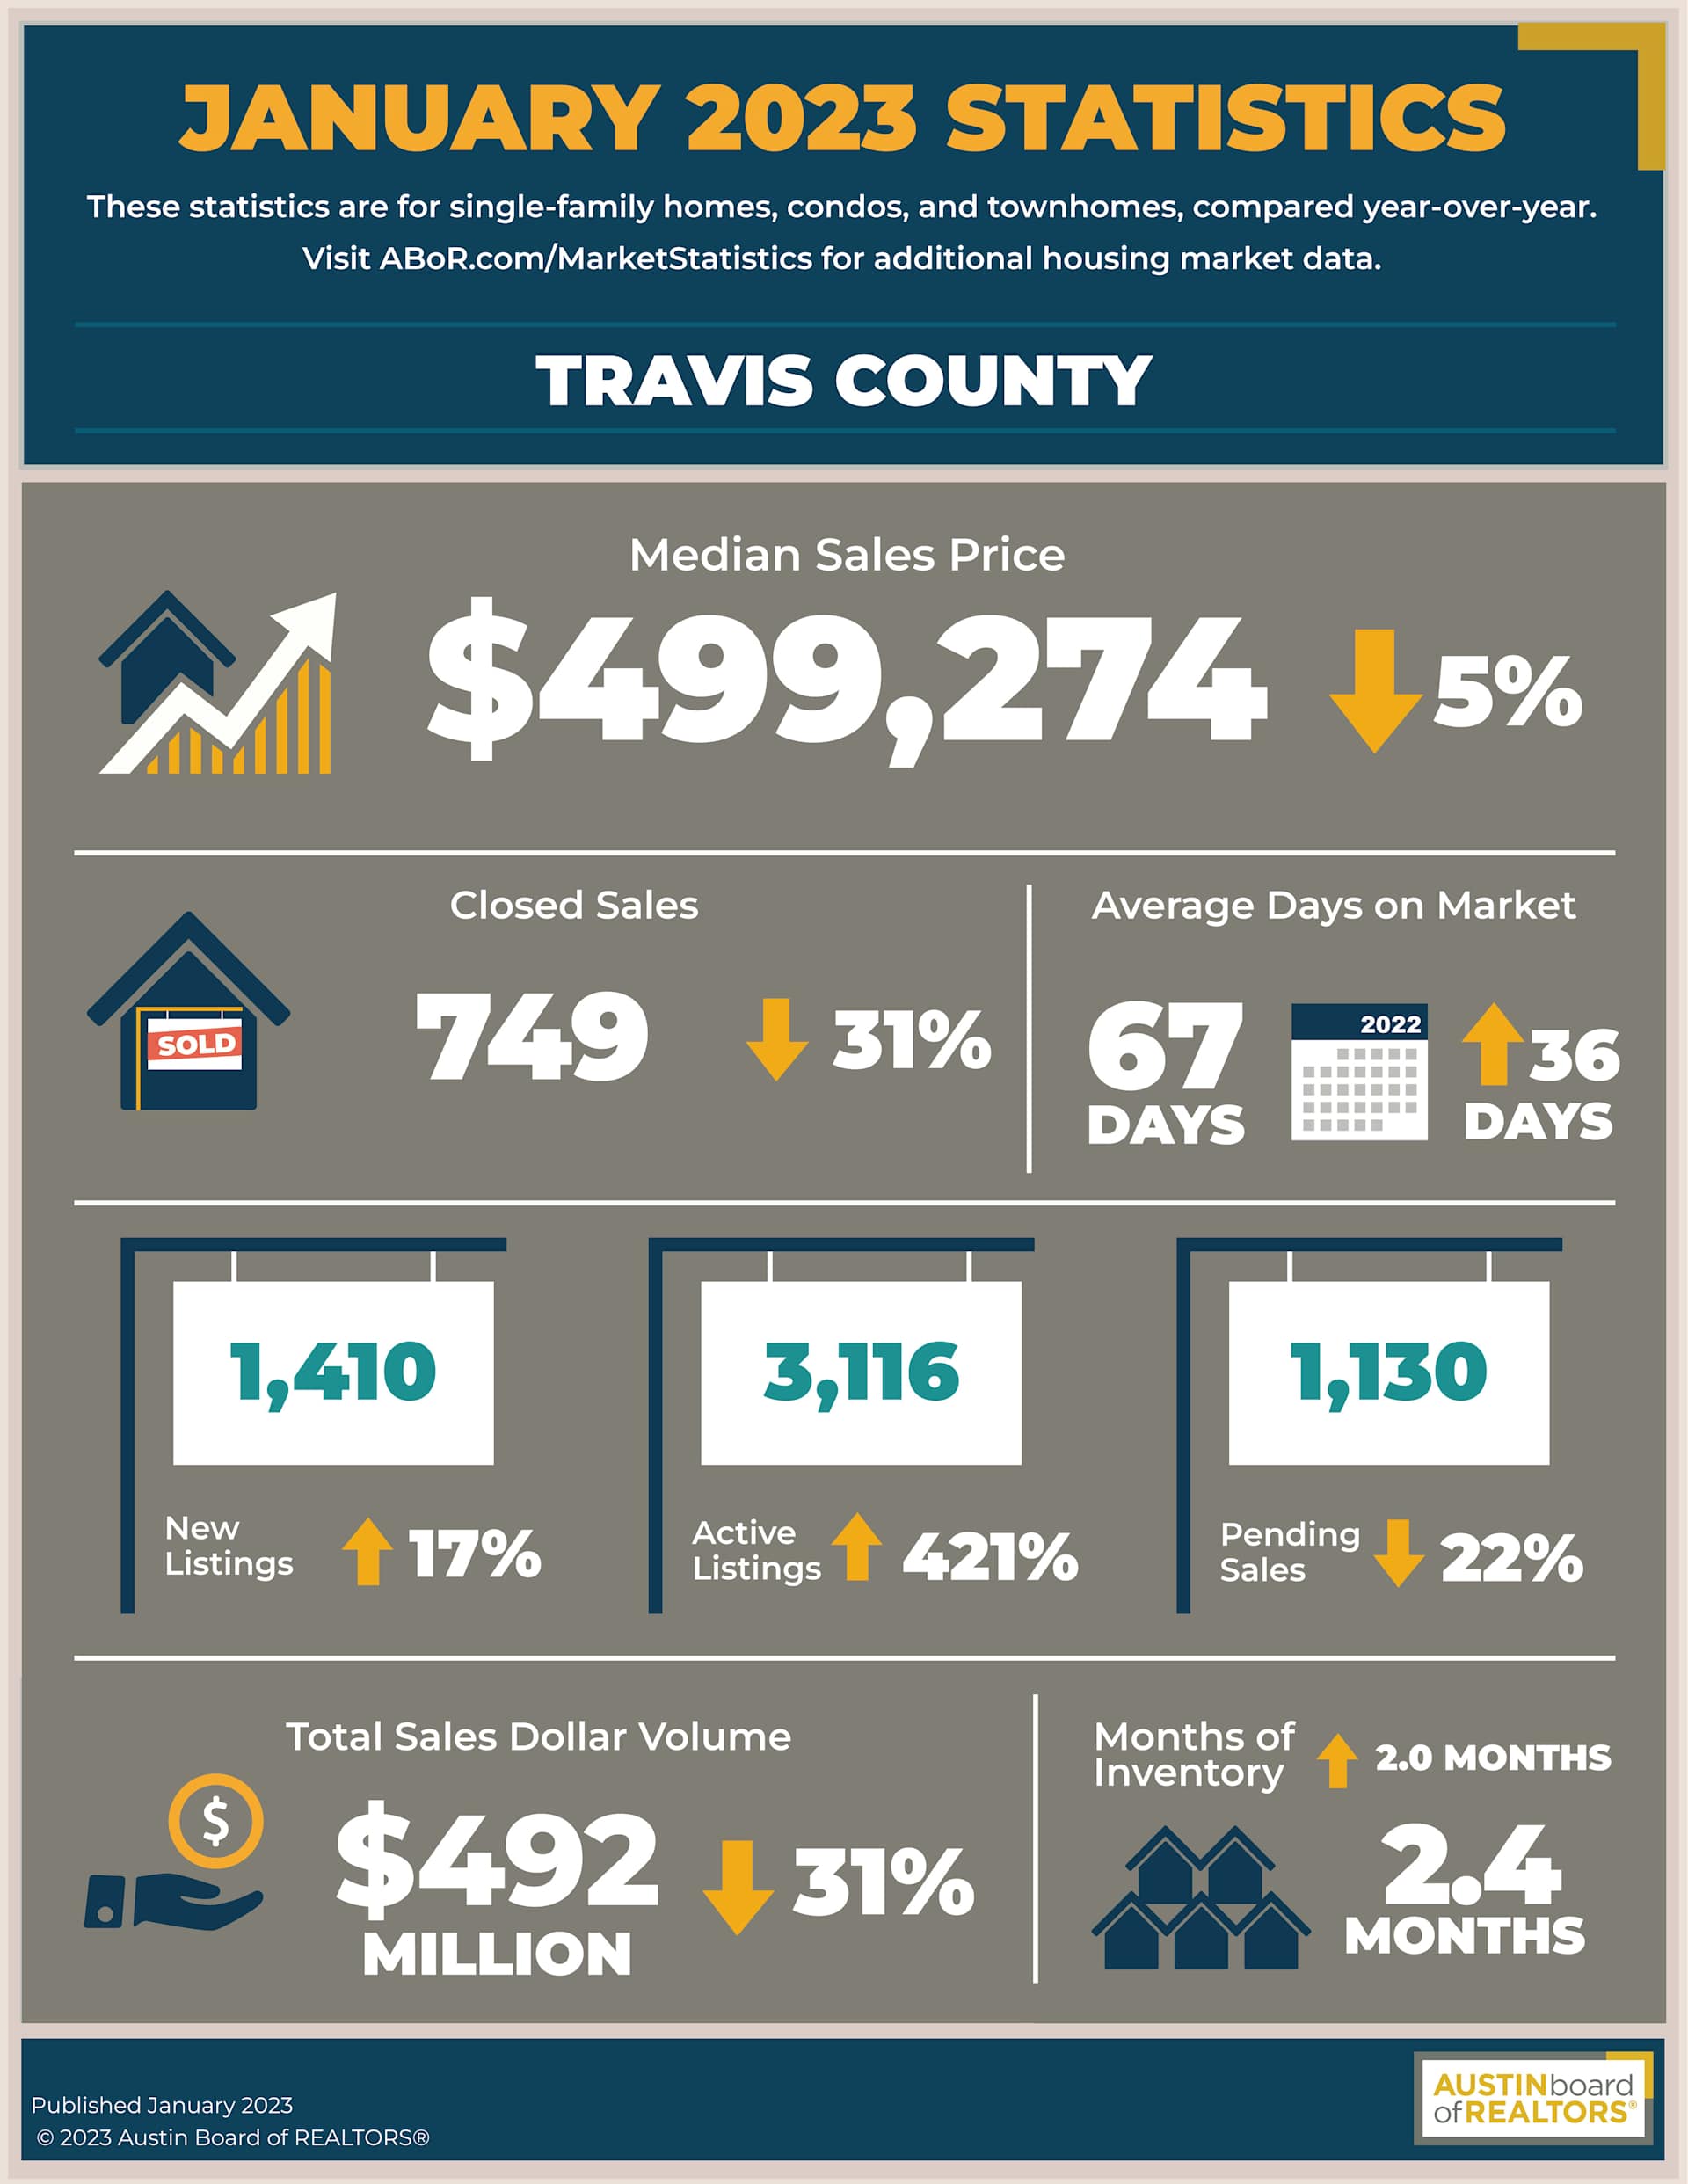
𝐓𝐫𝐚𝐯𝐢𝐬 𝐂𝐨𝐮𝐧𝐭𝐲
In Travis County, home sales decreased 31.7% to 749 sales, while sales dollar volume decreased 31.3% to $492,893,906. Last month, the median price in Travis County slightly dipped 5.9% year over year to $499,274, while new listings increased 17.0% to 1,410 listings and active listings ballooned 421.9% to 3,116 listings year over year. Pending sales declined 22.3% to 1,130 pending sales as monthly housing inventory increased 2.0 months year over year to 2.4 months of inventory.
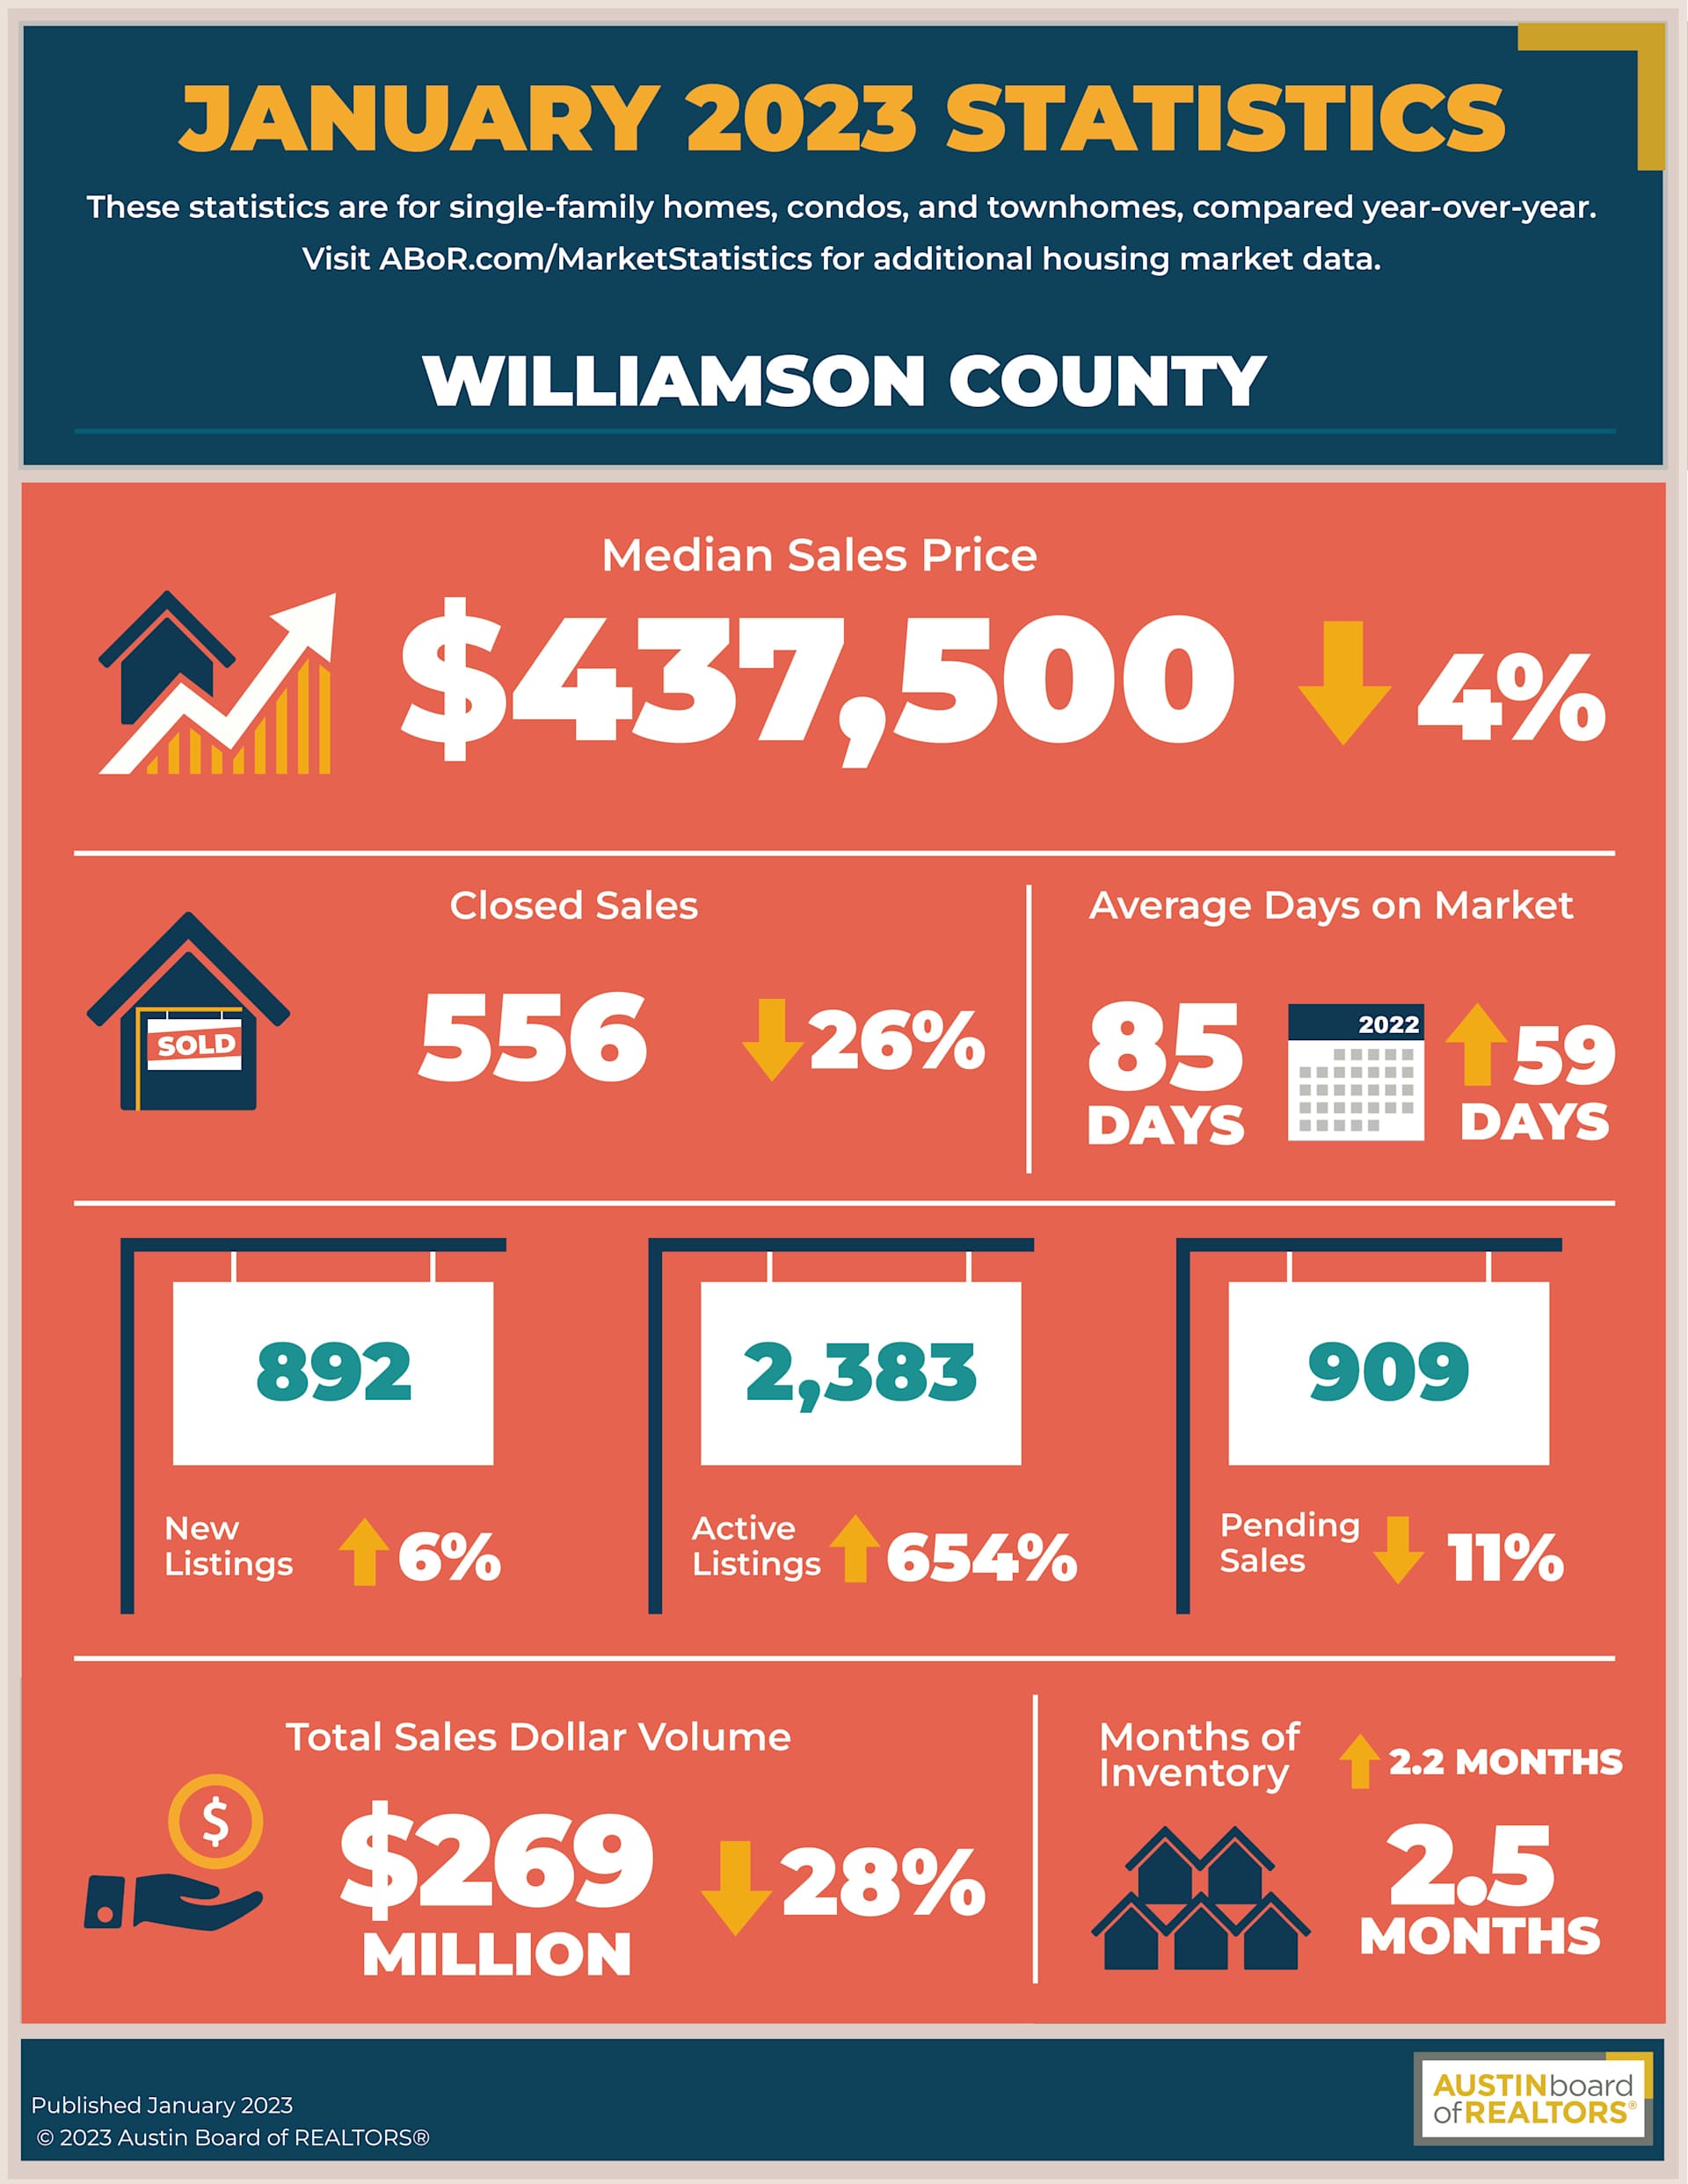
𝐖𝐢𝐥𝐥𝐢𝐚𝐦𝐬𝐨𝐧 𝐂𝐨𝐮𝐧𝐭𝐲
January home sales decreased 26.2% to 556 sales in Williamson County. Sales dollar volume declined 28.8% year over year to $269,359,523. The median price slightly decreased 4.9% to $437,500 as new listings ticked up 6.8% to 892 listings. During the same period, active listings soared 654.1% to 2,383 listings while pending sales dropped 11.4% to 909 pending sales. Housing inventory rose 2.2 months to 2.5 months of inventory.
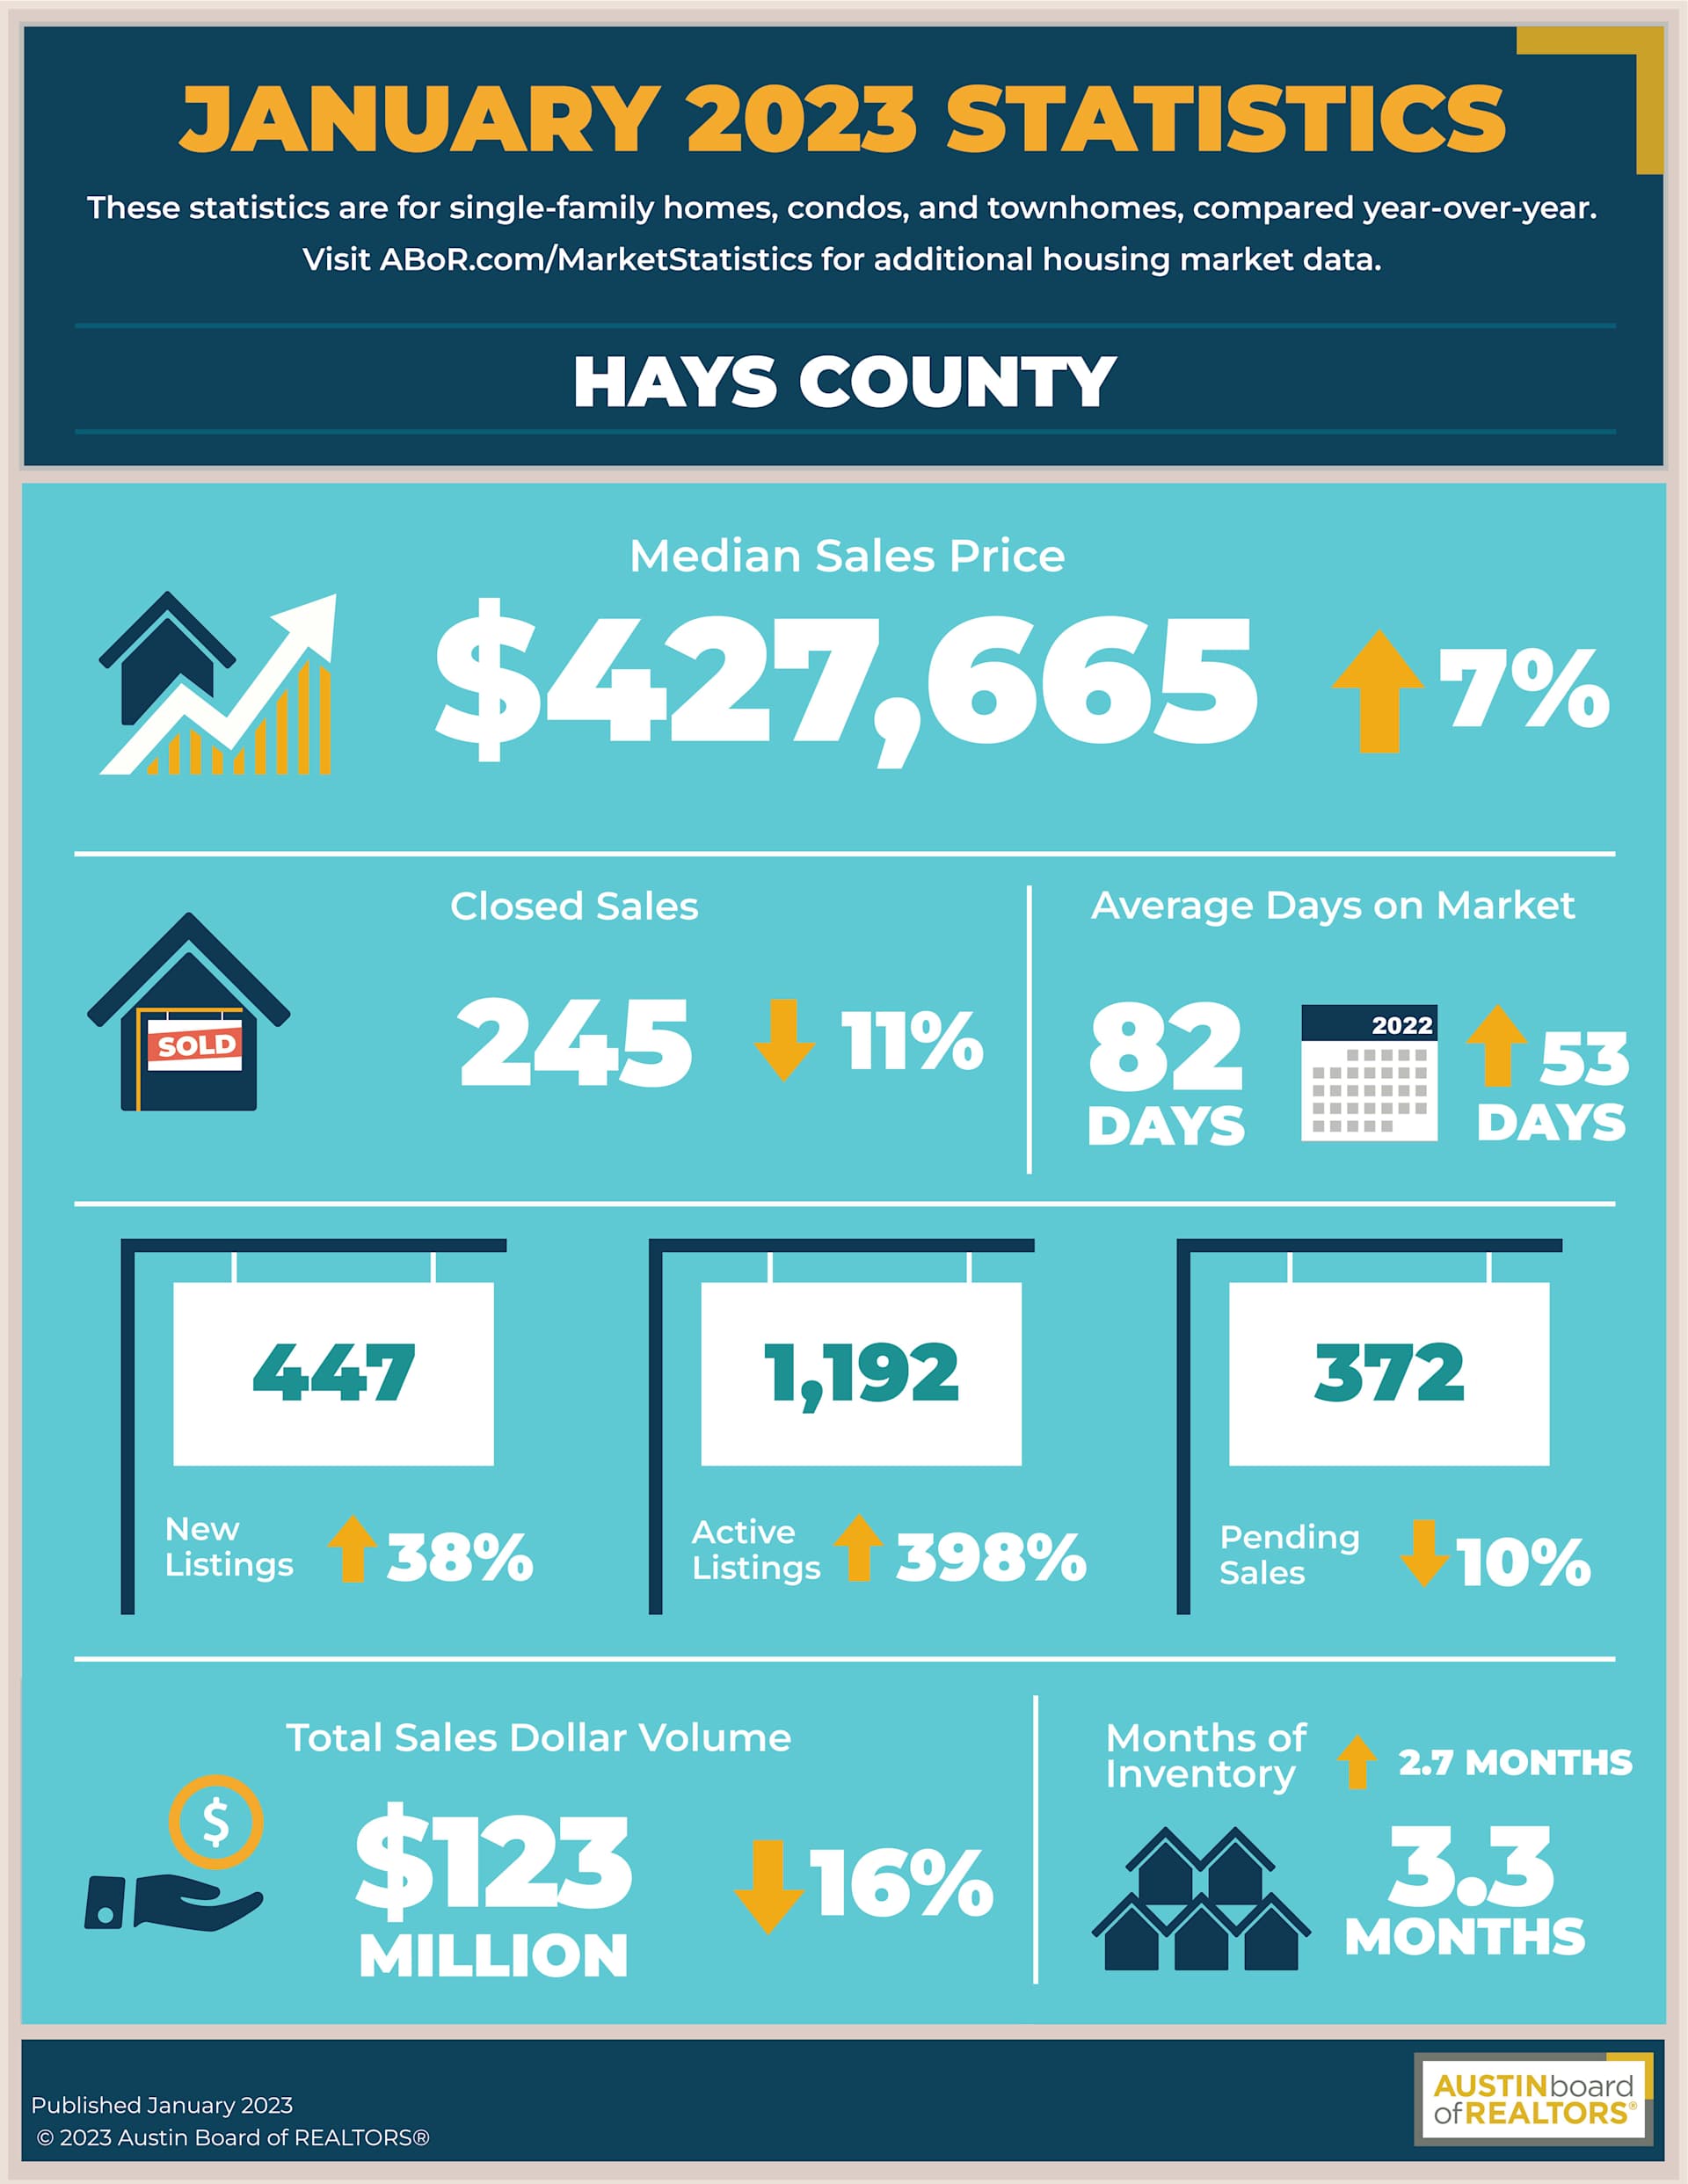
𝐇𝐚𝐲𝐬 𝐂𝐨𝐮𝐧𝐭𝐲
In Hays County, January home sales decreased 11.9% to 245 sales and sales dollar volume also dropped 16.7% to $123,838,974. The median price for homes rose 7.3% to $427,665. During the same period, new listings increased 38.4% to 447 listings, while active listings skyrocketed by 398.7% to 1,192 listings. Pending sales slightly decreased 10.1% to 372 pending sales as housing inventory jumped by 2.7 months to 3.3 months of inventory.
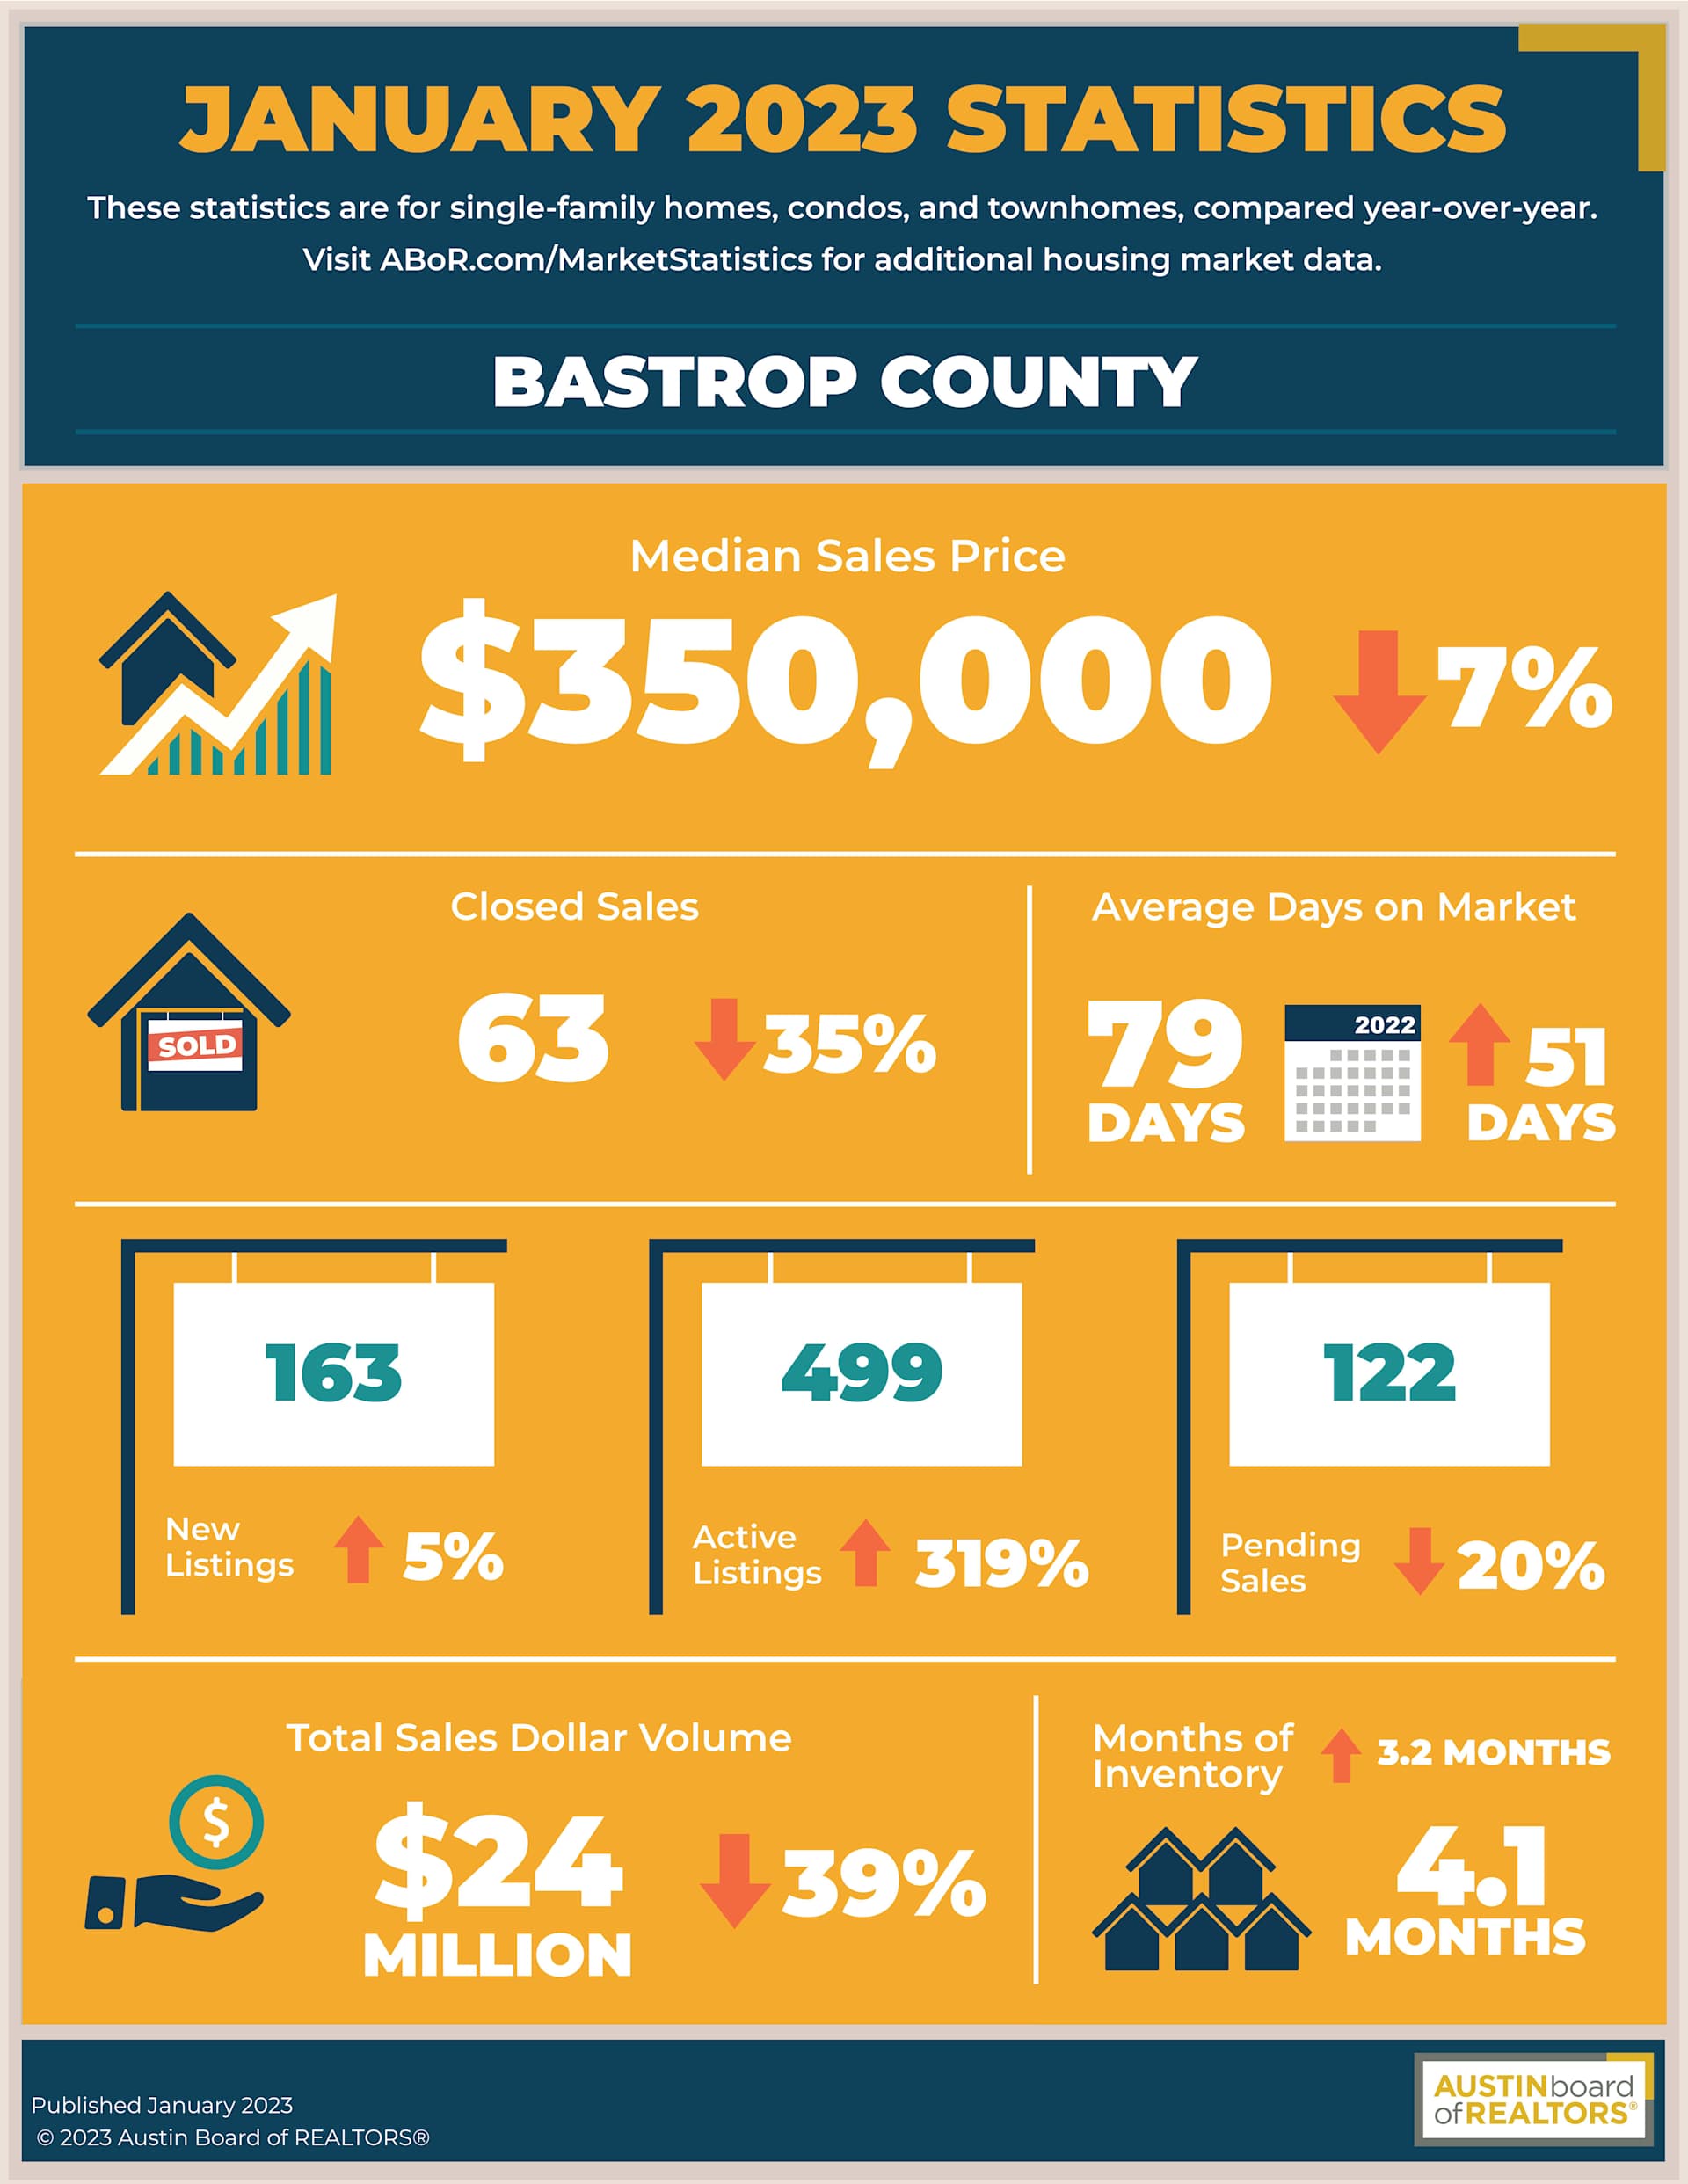
𝐁𝐚𝐬𝐭𝐫𝐨𝐩 𝐂𝐨𝐮𝐧𝐭𝐲
Last month, Bastrop County home sales decreased 35.7% year over year to 63 sales, while sales dollar volume also fell by 39.2% to $24,904,074. Median price decreased 7.9% to $350,000 as new listings ticked up 5.2% to 163 listings. Active listings soared 319.3% to 499 listings as pending sales decreased 20.8% to 122 pending sales. Housing inventory increased by 3.2 months to 4.1 months of inventory, the highest level of inventory across the MSA in January.
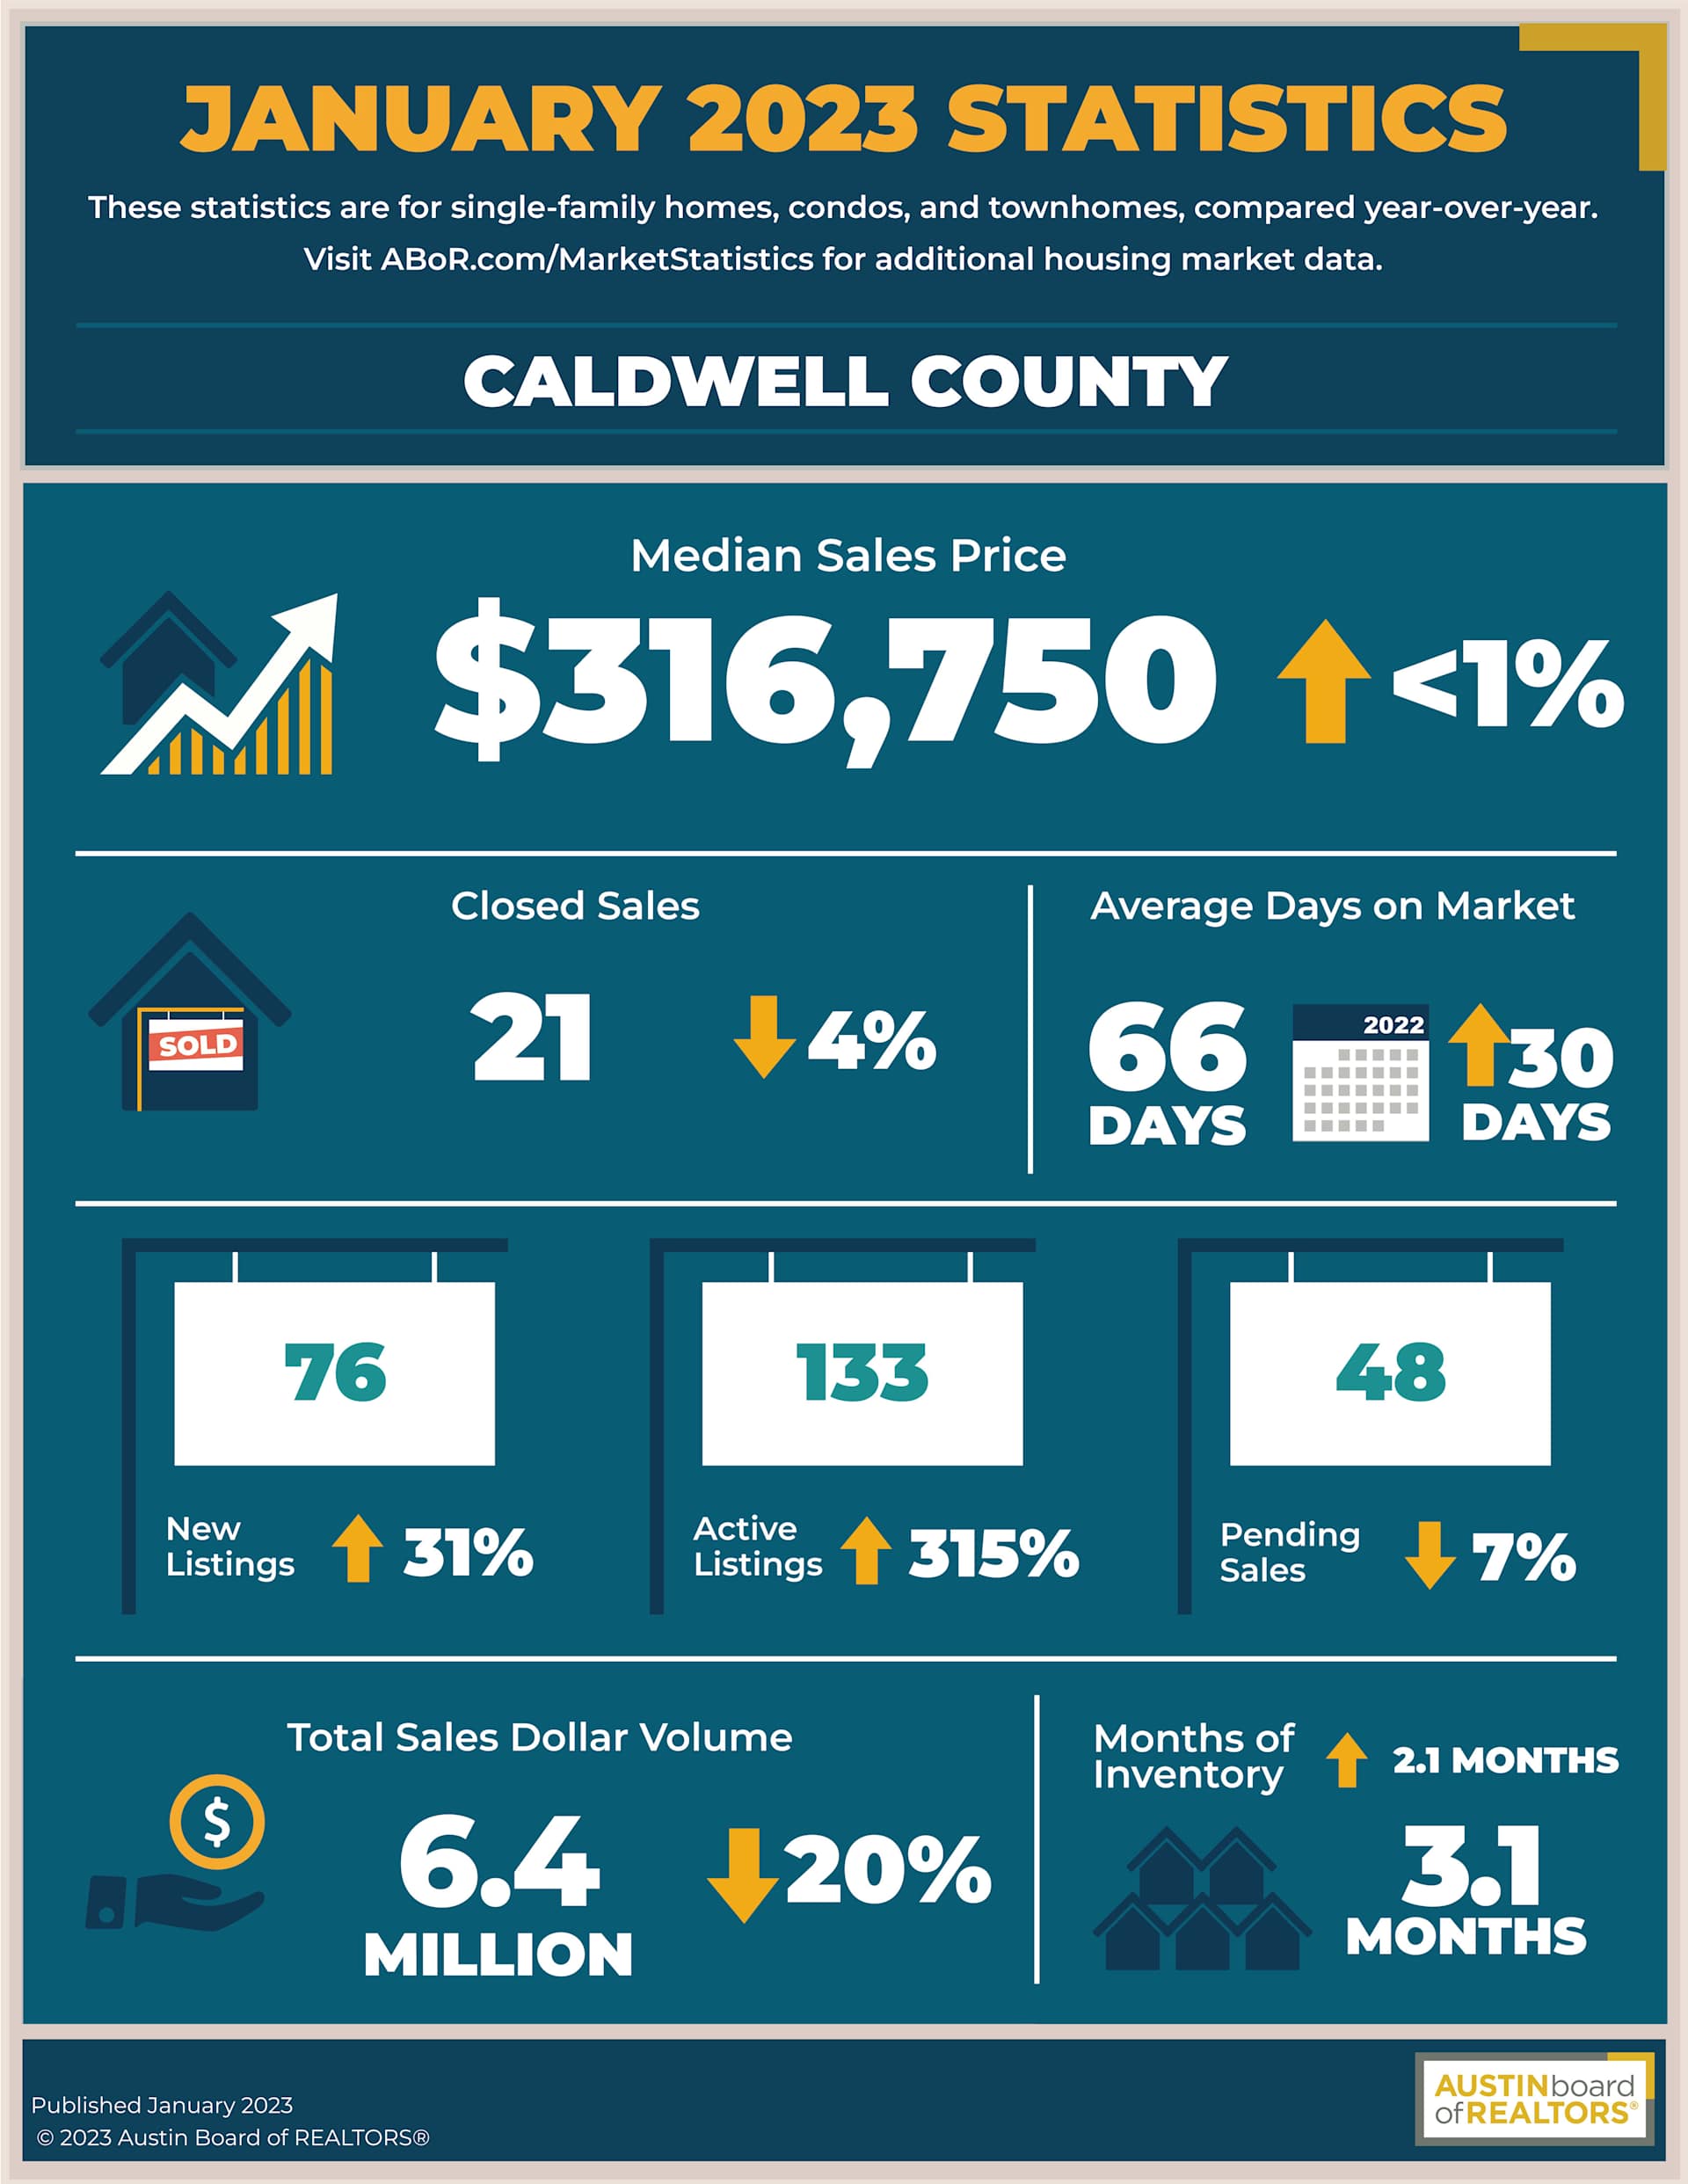
𝐂𝐚𝐥𝐝𝐰𝐞𝐥𝐥 𝐂𝐨𝐮𝐧𝐭𝐲
In Caldwell County, home sales decreased 4.6% year over year to 21 sales, and sales dollar volume also dropped 20.0% to $6,458,267. The median home price slightly rose 0.6% year over year to $316,750. At the same time, new listings increased by 31.0% to 76 listings as active listings skyrocketed 315.6% to 133 listings. Pending sales decreased 7.7% to 48 pending sales, and housing inventory increased 2.1 months to 3.1 months of inventory.